Hit
T
your keyboard for express version →
•
2024
From Days to Minutes: Redesigning Aflac's Dashboard to monitor 10K users monthly
From Days to Minutes: Redesigning Aflac's Dashboard to monitor 10K users monthly

MY ROLE
Lead UX Design
Senior Product Designer
TIMELINE
6 Months
2 Months
RESPONSIBILITIES
UX Research
UX Research, Stakeholder Presentations, Prototyping, User Testing, UI Design, Dataviz Design
Stakeholder Presentations
Prototyping
User Testing
UI Design
Dataviz Design
A talent acquisition platform seeking a compelling UX approach and immersive experience.
BMW STEP is amongst the most extensive technician training schemes across North America. They are recognized for their practical methodology and thorough enhancement of technical skills. Yet, their official website seemed antiquated and overloaded with content, lacking a narrative to support its value proposition. As a result, the site faced increased bounce rates, diminished traffic, and reduced page duration.
Aflac’s marketing organization lacked visibility into how marketing materials were being used across a distributed workforce of more than 10,000 employees.
Teams relied on manual reports and local spreadsheets, leading to inconsistent data, delayed decisions, and fragmented operational visibility.
Leadership needed a centralized monitoring system that could provide clarity at scale without increasing workload or reducing regional flexibility.
MY ROLE
Senior Product Designer
TEAM
I worked on this project
with a mid-level Product Designer
RESPONSIBILITIES
UI Design
Stakeholder Presentations
Prototyping
User Testing
Dataviz Design
TL;DR
Redesigned a fragmented reporting process reliant on manual spreadsheets into a centralized, role-based monitoring system, driving a 66x increase in material usage monitoring and cutting tracking time from days to minutes.
TL;DR
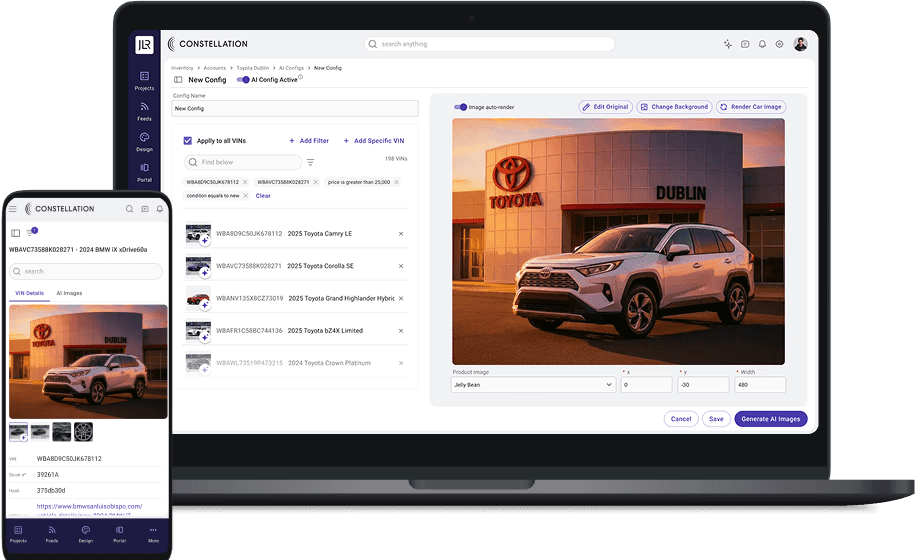
Rebuilt an image tool capped at 80% inventory coverage into a system that generates unlimited GenAI asset combinations, reaching 100% coverage and cutting setup time from 5 minutes to nearly 1 minute.
PROBLEM
Management had no visibility on platform usage and couldn't take strategic decisions
Aflac's existing tool tracked only a handful of metrics, was unintuitive, and couldn't scale. It handled at most 75 to 100 marketing materials a month, while actual usage ran about 66x higher, so most activity went unmonitored and the tool sat underused. Without visibility into real usage, the client couldn't make informed decisions, and didn't know what kind of solution, or what kind of decisions, the missing data could even support.
SOLUTION
Every metric mapped to the business decision it served
Working with stakeholders, I mapped every metric that mattered and the business logic behind each one, then grouped them thematically based on how they related to each other rather than how they'd been collected. I proposed additions the client hadn't tracked before: usage broken down by material type, and a split between English and Spanish materials, given how much of the workforce relied on Spanish-language content. The result was a dashboard organized into thematic modules instead of a flat list of numbers, closing the gap the old tool had created: a 66x increase in monitoring of material usage, tracking time cut from days to minutes, and 6+ new metrics added to the product.
PROBLEM
Management had no visibility on platform usage and couldn't take strategic decisions
Aflac's existing tool tracked only a handful of metrics, was unintuitive, and couldn't scale. It handled at most 75 to 100 marketing materials a month, while actual usage ran about 66x higher, so most activity went unmonitored and the tool sat underused. Without visibility into real usage, the client couldn't make informed decisions, and didn't know what kind of solution, or what kind of decisions, the missing data could even support.
SOLUTION
Every metric mapped to the business decision it served
A config is a saved AI image template: background, angle and lighting, that can be applied and integrated to any VIN (vehicle). The mandate was to go from one config for the entire inventory to unlimited config-to-VIN combinations, without forcing a new mental model onto existing users. Speed had to scale with coverage: the old flow took about 5 minutes per set, the new one takes one minute.
IMPACT
IMPACT
IMPACT
66x
increase in monitoring of material usage.
66x
increase in monitoring of material usage.
66x
increase in monitoring of material usage.
Tracking time
Reduced from days to minutes across distributed teams
Tracking time
Reduced from days to minutes across distributed teams
Tracking time
Reduced from days to minutes across distributed teams
6+
New relevant metrics added to the product
6+
New relevant metrics added to the product
6+
New relevant metrics added to the product
Main Goals
Main Goals
Reduce manual reporting effort across regions
Increase adoption of standardized marketing materials
Enable real-time visibility for leadership decisions
Maintain system consistency as asset volume grows
Initial Challenge
Initial Challenge
Since the former platform were underused, the client was confused of what kind of solution they would need to track downloads on the new system.
Since the former platform were underused, the client was confused of what kind of solution they would need to track downloads on the new system.
Research
Research
We discovered that regional teams were creating parallel tracking spreadsheets, revealing a lack of system trust and structural clarity rather than a lack of tools.
We discovered that regional teams were creating parallel tracking spreadsheets, revealing a lack of system trust and structural clarity rather than a lack of tools.
UX Strategy
UX Strategy
Progressive disclosure to avoid cognitive overload
Configurable modules instead of static dashboards
Role-based visibility to preserve structural clarity
Layered information architecture to support scale
Instead of extending the single-config model, we re-architected the system to support:
Multiple configurations per VIN
Scoped rule-based application
Permission-based overrides
Visualized impact before deployment
This shifted the platform from static assignment to dynamic logic orchestration. The design challenge became one of containment — shaping complexity instead of hiding it.


TRADE-OFFS
TRADE-OFFS
TRADE-OFFS
Balancing scalability, clarity, and usability in a growing monitoring ecosystem
Decision
Why
Risk
Mitigation
Modular Dashboard Architecture
High scalability
Higher initial complexity
Enabled long-term expansion without redesign or structural debt
Qualitative Feedback Integration
Nuanced decision-making
Increased data interpretation complexity
Enabled administrators to understand behavioral patterns and intent behind quantitative metrics rather than relying on raw numbers alone
Configurable Metrics
Flexibility
Higher QA and validation effort
Allowed contextual insights without compromising system integrity
HIGHLIGHTS
HIGHLIGHTS
HIGHLIGHTS

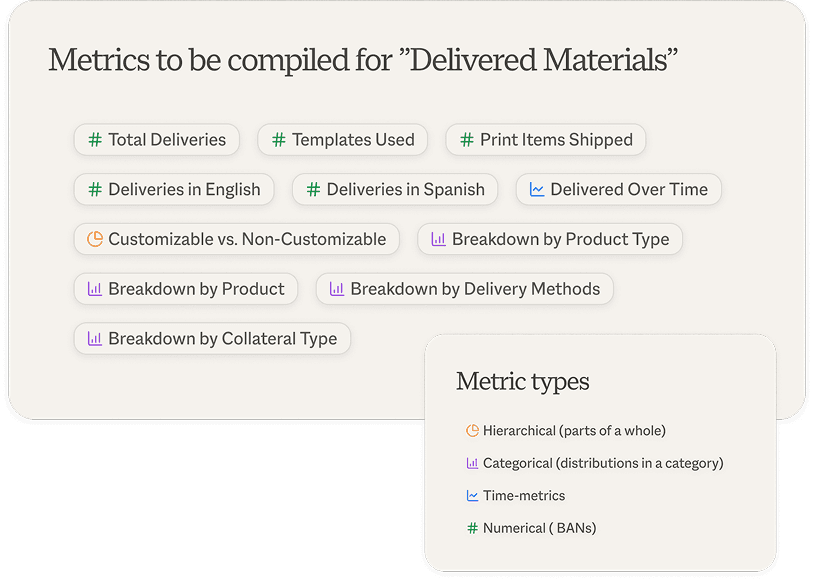
Creating a Metrics Inventory
First step of the challenge was gathering the necessary metrics to be tracked by the team. Then we categorized those metrics and group them strategically, to align with the dashboard’s information architecture.

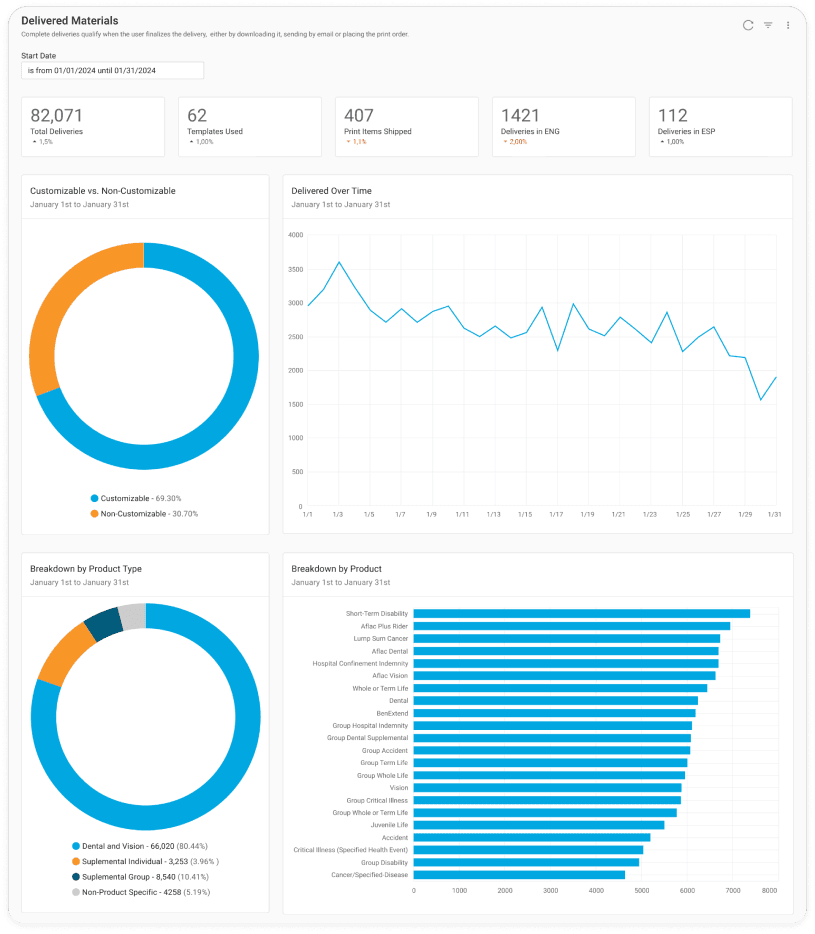

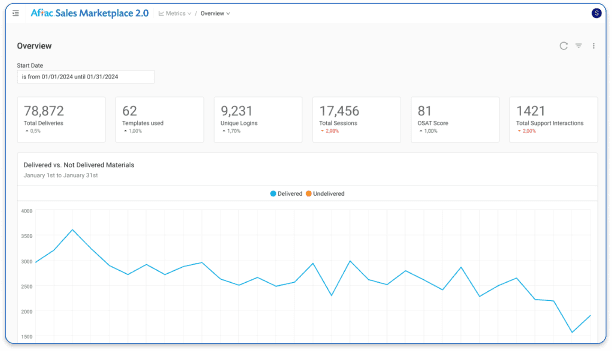
Dashboard anatomy
After defining the key metrics, it was crucial to determine an arrangement of the charts, so that it was easy to digest, and one metric was a natural consequence of the other.


Navigation plan
Since 7 new dashboard pages would be added to the platform, I planned the Information Architecture in a way they would make sense and reduce time finding out their logig


Controls and Qualitative Feedback
Users needed to be able to select different time frames, to refine their analysis. It would also be helpful to provide a qualitative breakdown on the data, so users better understand nuanced information.

Creating a Metrics Inventory
First step of the challenge was gathering the necessary metrics to be tracked by the team. Then we categorized those metrics and group them strategically, to align with the dashboard’s information architecture.
Dashboard anatomy
After defining the key metrics, it was crucial to determine an arrangement of the charts, so that it was easy to digest, and one metric was a natural consequence of the other.
Navigation plan
Since 7 new dashboard pages would be added to the platform, I planned the Information Architecture in a way they would make sense and reduce time finding out their logig
Controls and Qualitative Feedback
Users needed to be able to select different time frames, to refine their analysis. It would also be helpful to provide a qualitative breakdown on the data, so users better understand nuanced information.
RESPONSIBILITIES
RESPONSIBILITIES
RESPONSIBILITIES
What did I actually do?
Identified what had to be preserved before changing anything
Identified what had to be preserved before changing anything
Audited the existing dashboard with customers to uncover visualization and usability gaps
Audited the existing dashboard with customers to uncover visualization and usability gaps
Created the data framework that structured the dashboard architecture
Created the data framework that structured the dashboard architecture
Mentored a mid-level designer throughout execution
Mentored a mid-level designer throughout execution
Validated decisions through user testing
Validated decisions through user testing
Shipped
Shipped
LEARNINGS
LEARNINGS
LEARNINGS
Structure Enables Scale
Clear system structure reduces friction and allows complexity to grow without overwhelming users or breaking consistency.
Metrics Need Context
Numbers alone create false confidence. Combining quantitative data with qualitative feedback leads to more informed decisions.
Metrics Need Context
Numbers alone create false confidence. Combining quantitative data with qualitative feedback leads to more informed decisions.
Flexibility Requires Boundaries
Allowing local adaptability works best when supported by invisible guardrails that preserve coherence across teams.
Clarity Beats Feature Density
Usability improves when information is layered and intentional, rather than exposing every capability at once.
Clarity Beats Feature Density
Usability improves when information is layered and intentional, rather than exposing every capability at once.